Smart energy monitoring application
WattWächter
A cross-platform Flutter application for configuring WattWächter Plus hardware and turning live electricity meter data into understandable consumption, feed-in, cost, and historical views.
- Role
- Flutter Developer
- Focus
- Flutter feature development, Hardware-connected mobile flows, iOS and Android delivery
- Platform
- Flutter, Dart, Bluetooth, Local network communication, iOS and Android
Public product views
From a live meter signal to useful energy context
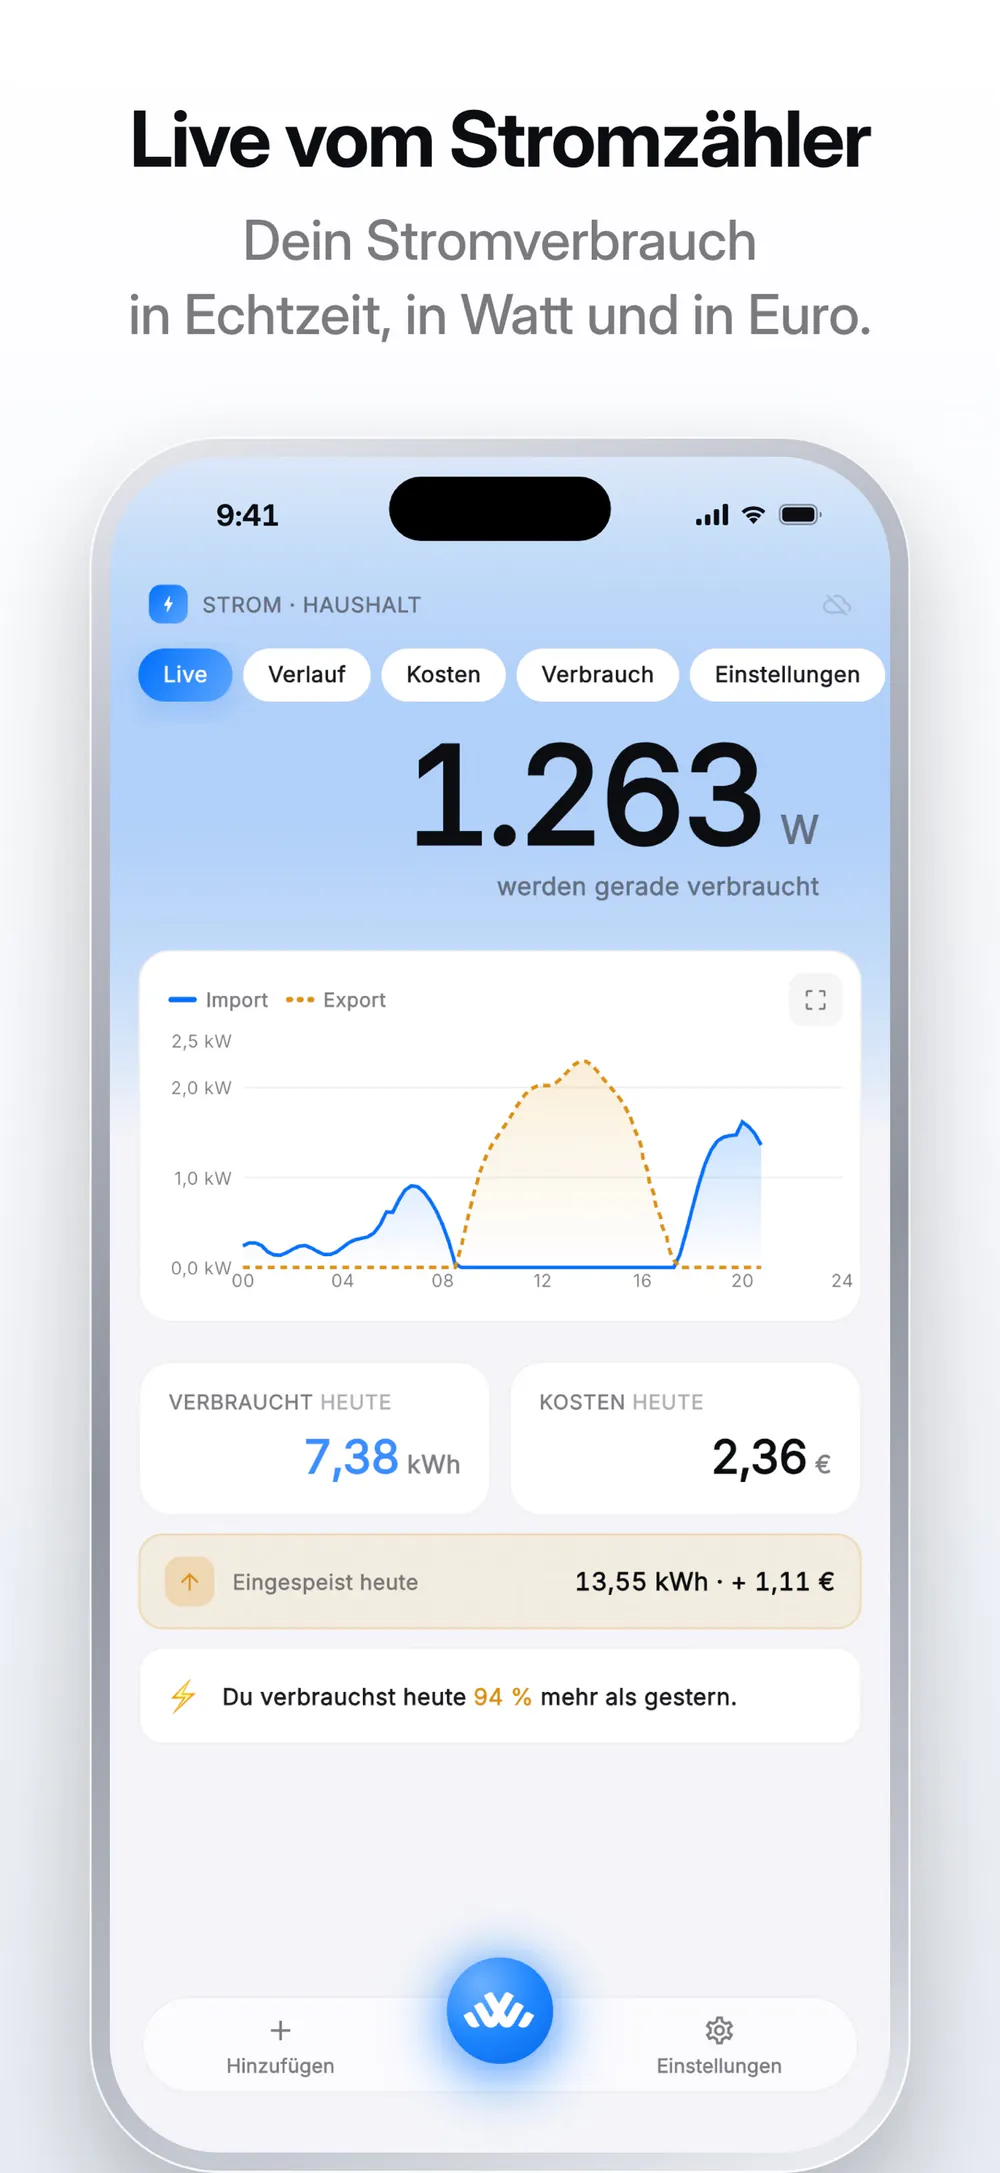
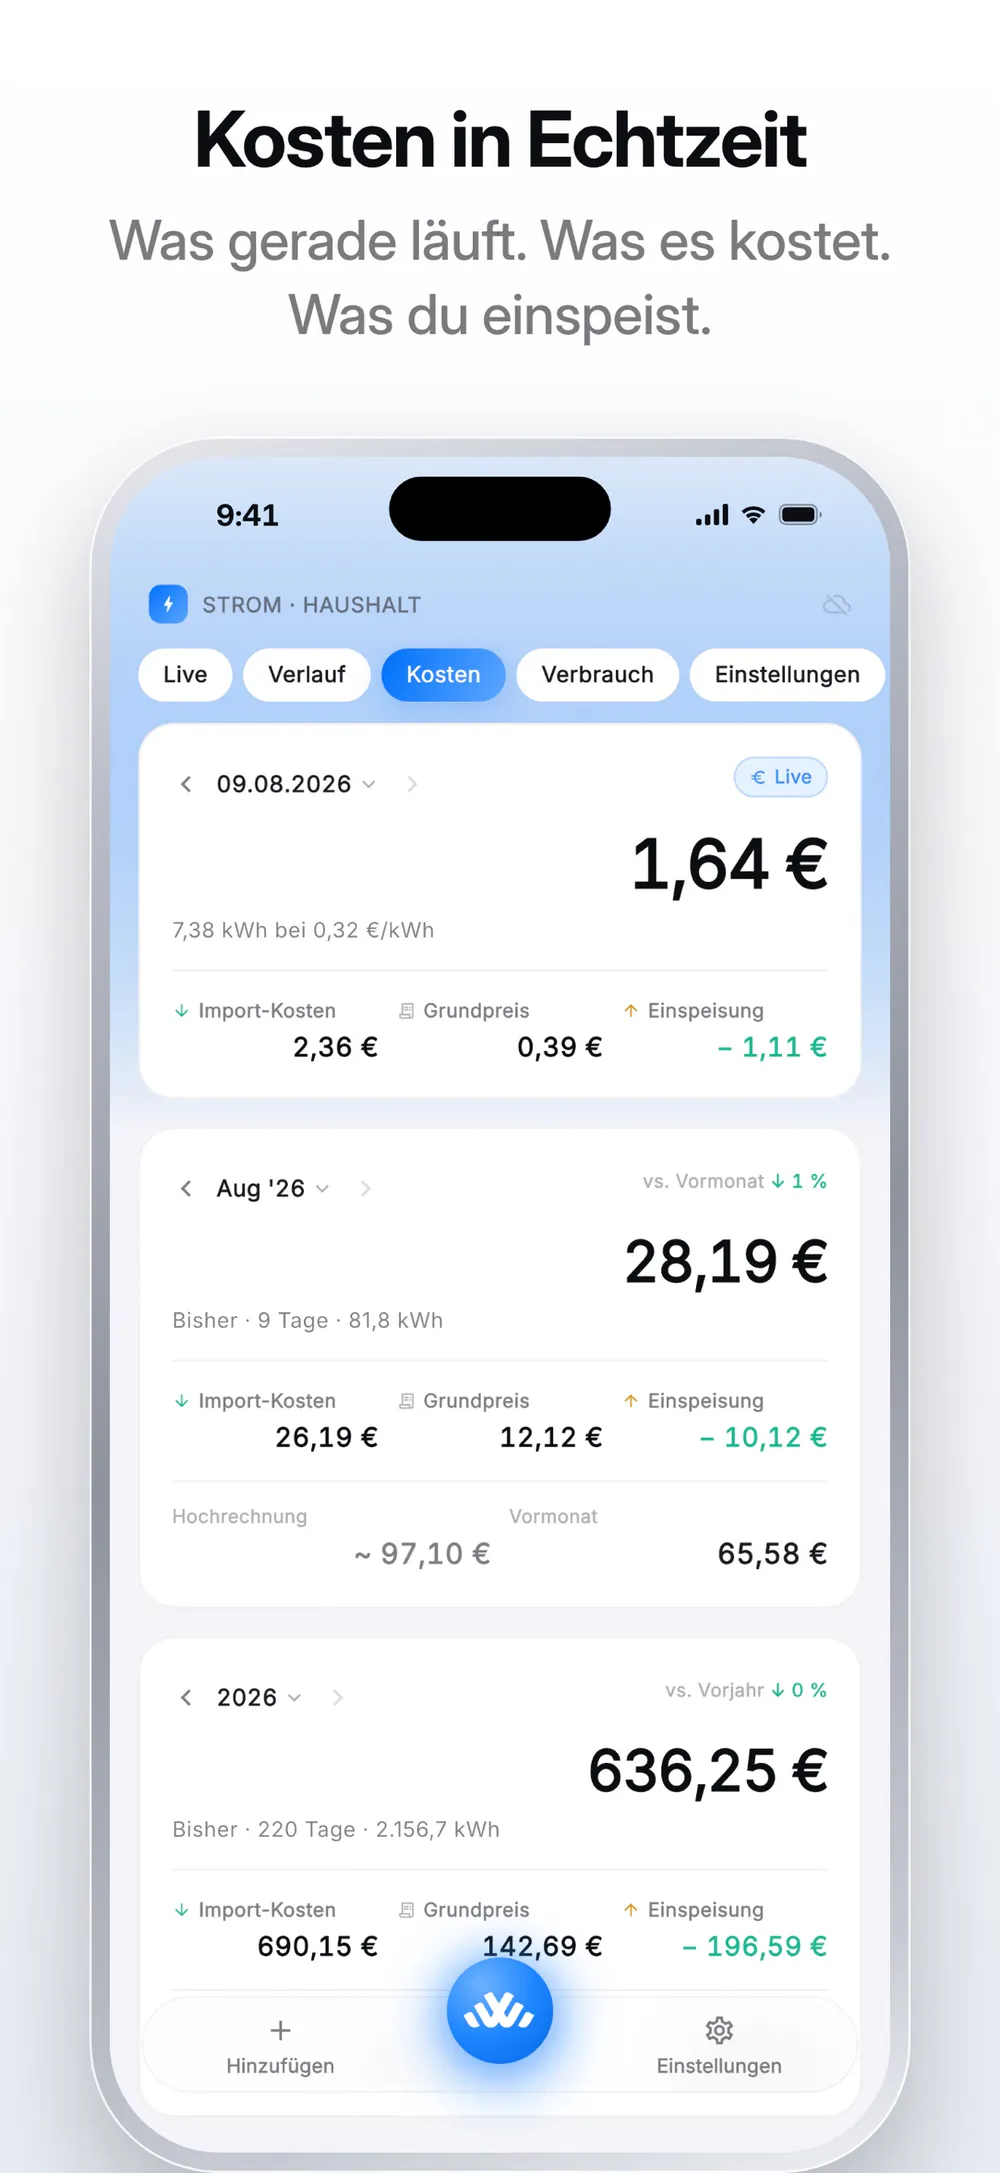
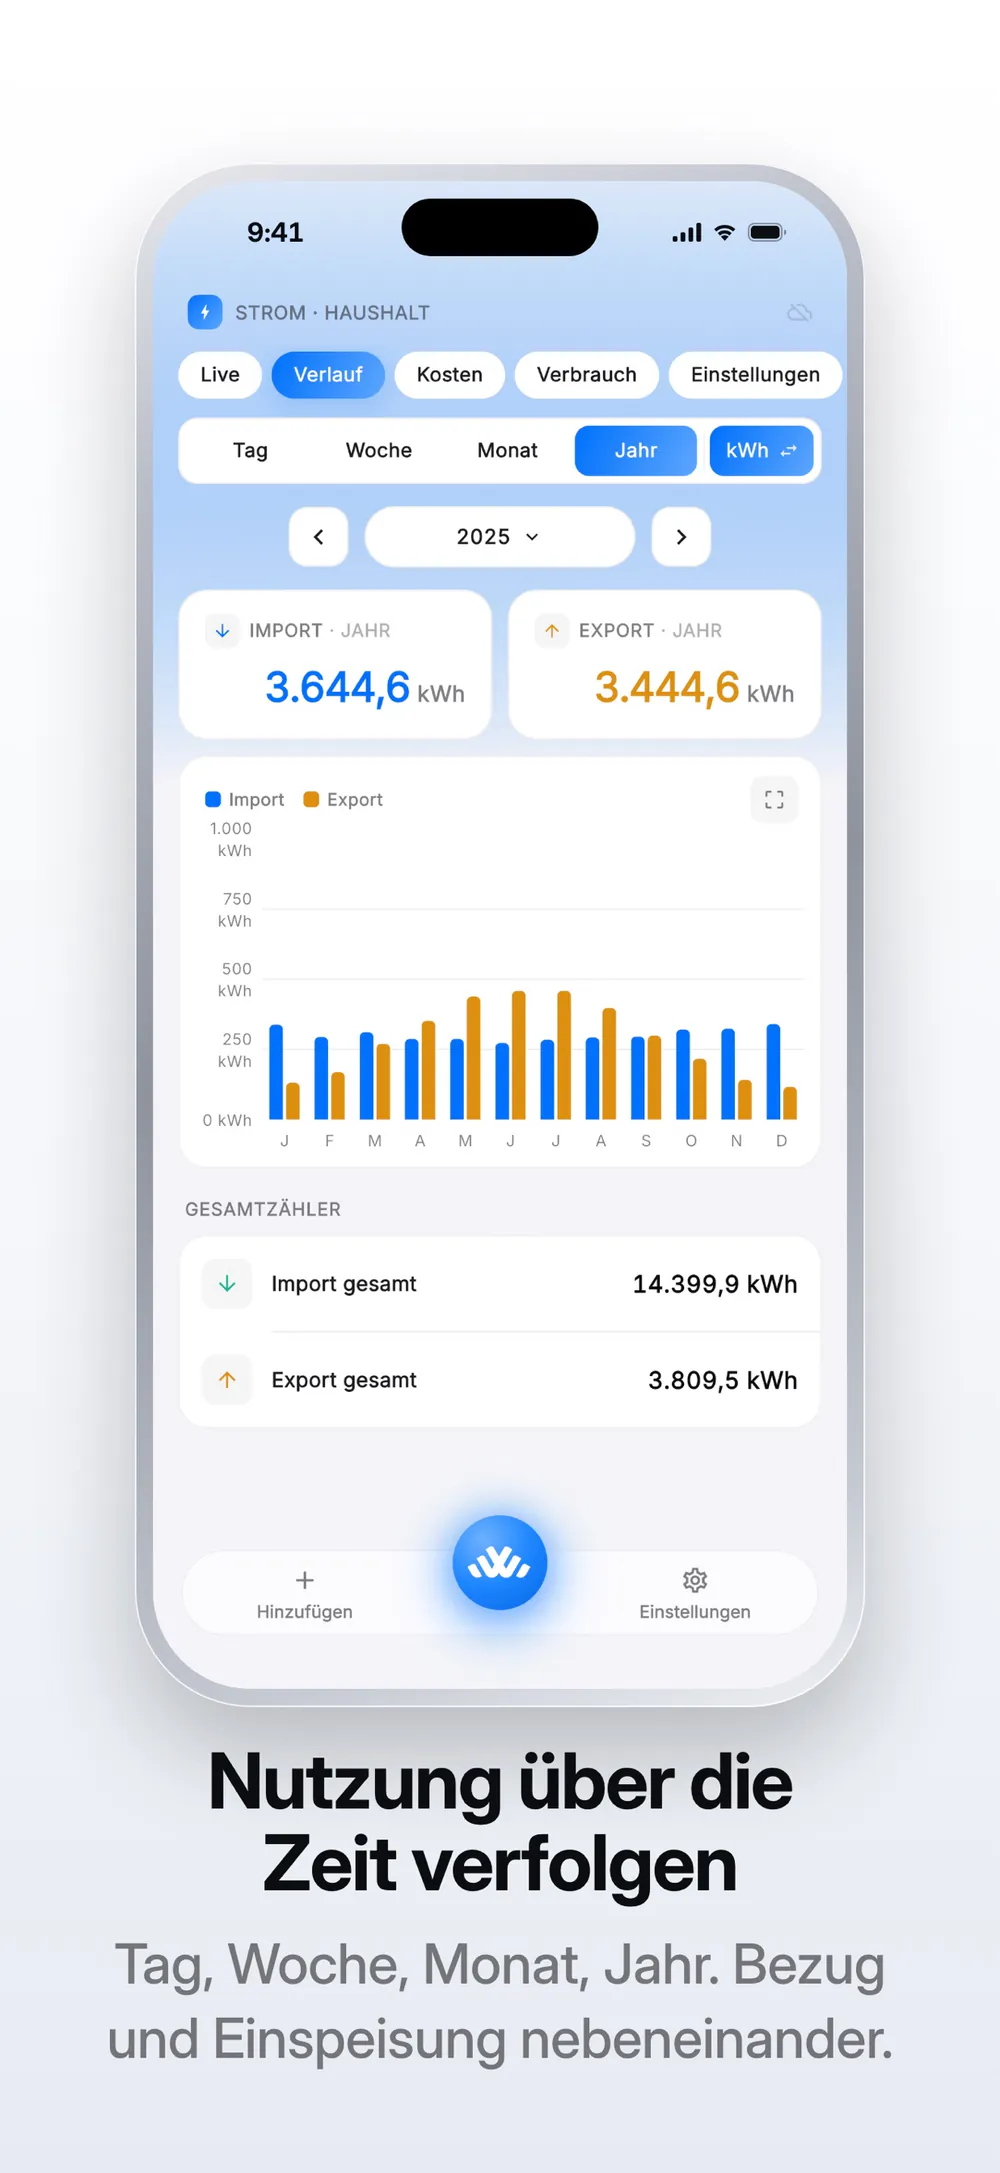
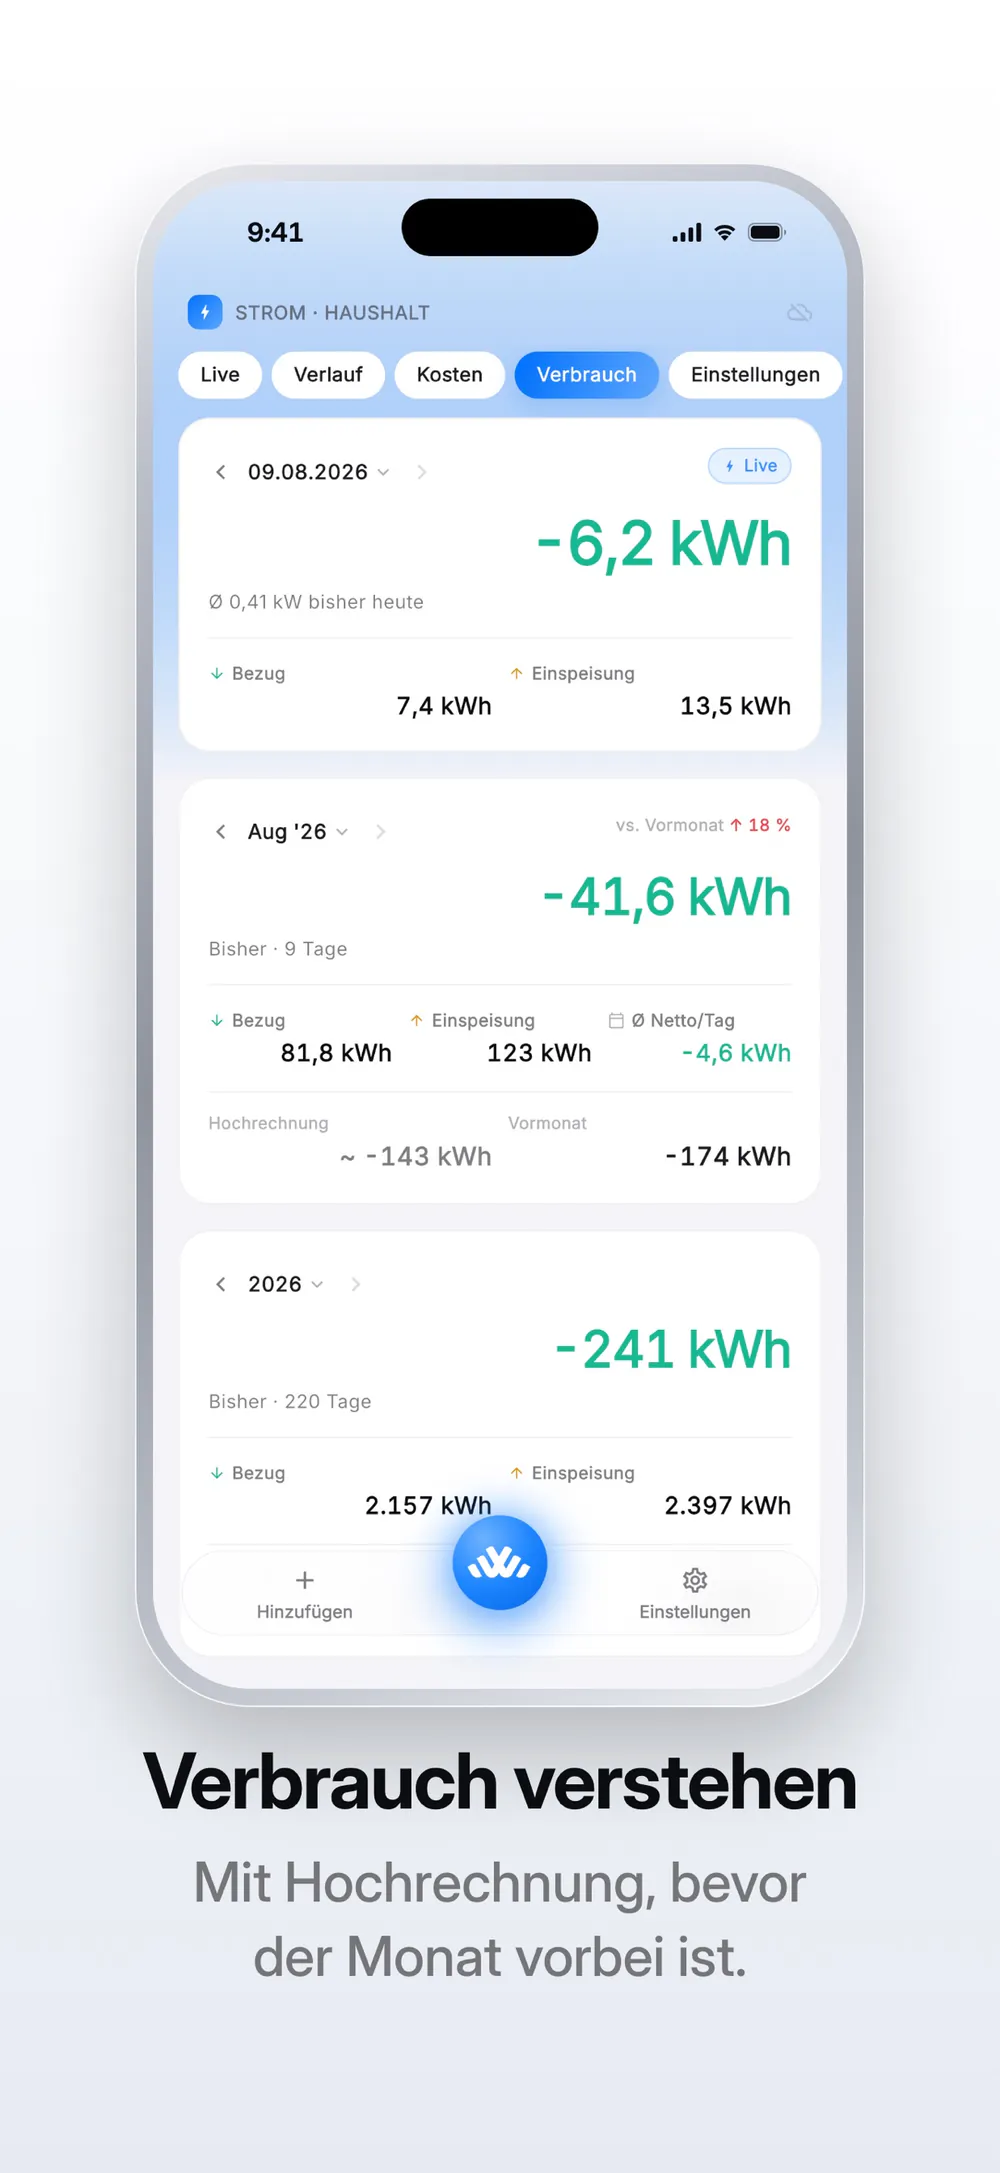
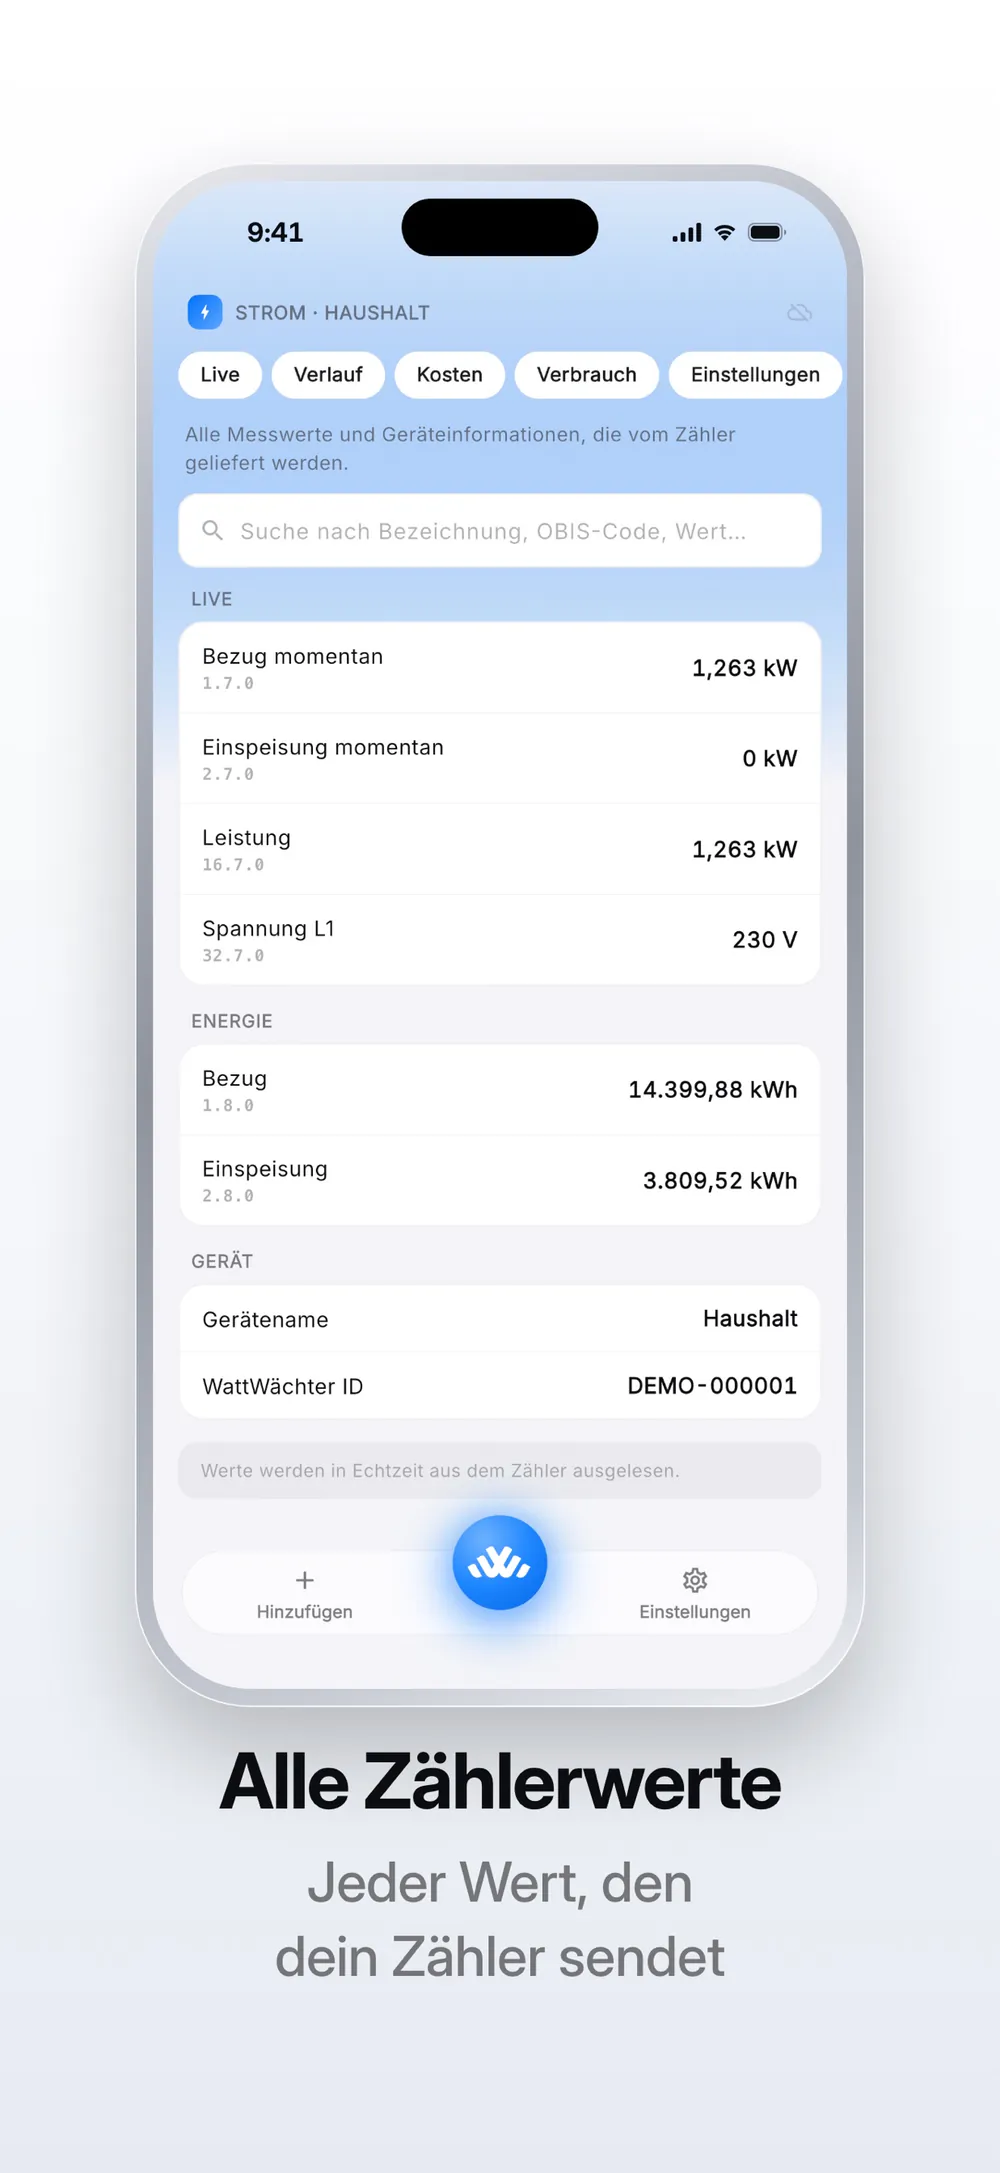
Selected public screens showing live power, tariff-based costs, historical comparison, energy balance, and detailed meter values.
Challenge
What needed to be made clear
Turn hardware connectivity and continuously changing electricity meter values into a mobile experience that remains reliable, understandable, and useful beyond a single live reading.
Solution
A structure built around change
Guide users through device commissioning, separate live power from accumulated energy and cost, preserve local operation, and provide consistent comparisons across day, week, month, and year.
Product decisions
Product decisions reflected in the Flutter experience
- Use a guided Bluetooth and Wi-Fi setup flow to connect the physical reader without exposing unnecessary device complexity.
- Separate current power, energy consumption, grid feed-in, and monetary cost so each measurement keeps a clear meaning.
- Present day, week, month, and year history with period navigation, comparison values, and expandable charts.
- Keep meter and measurement data available locally while making remote synchronization an optional capability.
- Support multiple meters, diagnostic information, a demo meter, six languages, light and dark themes, and dedicated tablet layouts.
Product context
WattWächter is a smart energy monitoring product built around the WattWächter Plus reader for digital electricity meters. The mobile application configures the hardware, connects it to the local Wi-Fi network, and presents electricity usage and grid feed-in as live power, accumulated energy, historical trends, and monetary cost.
The product supports multiple meters and works locally through Bluetooth and the home network. Remote access can be enabled through optional cloud synchronization, while an account is not required for local use.
My contribution
I worked on the Flutter application and the delivery of its hardware-connected experience for iOS and Android. My contribution centered on product flows that connect device setup, live measurements, energy history, tariff configuration, diagnostics, multiple meters, and responsive presentation within one consistent application.
Because this was client work, the case study focuses on the public product and my Flutter responsibilities rather than private source code, internal architecture, device protocols, synchronization logic, or analytics.
Hardware onboarding in Flutter
The application guides users through discovering and configuring the WattWächter Plus reader over Bluetooth before connecting it to the local Wi-Fi network. This setup flow needs to communicate discovery, connection, configuration, success, and failure states without requiring users to understand the underlying hardware protocol.
A guided tour with a demo meter allows the interface and its core concepts to be explored before physical hardware is available. Status information and diagnostic export provide a practical path when device setup or communication needs support.
Real-time measurements with stable meaning
The live dashboard combines current power, grid import, feed-in, daily consumption, cost, and comparison to the previous day. Each value has a different unit and time context, so hierarchy, labeling, and color need to remain consistent while measurements continue to change.
The Flutter experience keeps the latest reading prominent while using charts and supporting cards to explain how the current moment contributes to a wider energy picture.
Consumption, history, and tariff costs
Historical views cover day, week, month, and year, with navigation between periods and full-screen chart presentation. Import and feed-in remain visually distinct across charts, totals, projections, and comparisons.
Users can configure their electricity price, base charge, and feed-in tariff. The application then presents energy not only in kWh, but also as daily, monthly, and yearly cost, including previous-period context and projected totals.
Local operation and responsive delivery
Meter and device data are processed locally, with optional synchronization used for remote access. This keeps the primary monitoring experience useful on the home network without making an account a requirement for the core product.
WattWächter is publicly available for iOS, iPadOS, and Android. The Flutter product supports phone and dedicated tablet layouts, portrait and landscape orientation on iPad, light and dark themes, and six public languages while preserving the same measurement model across devices.